CPT Reporting
Use this tool to calculate and visualize CPT Reporting.
About CPT Reporting
Soil Classification based on CPT test results
The Robertson CPT interpretation methods (1986, 1990, and 2010) provide a widely adopted framework for classifying soil behavior types (SBT) using cone penetration test (CPT and CPTU) data. These methods relate measured cone parameters to empirical soil zones, with classification focused on soil behavior (e.g., stiffness, drainage, compressibility) rather than strictly particle size or plasticity.
At the core of the method are the following measured or derived parameters:
qc: cone tip resistance (MPa or kPa)
fs: sleeve friction (kPa)
Rf = (fs / qc) × 100%: friction ratio (%)
u: pore water pressure (CPTU only)
σv0: total vertical stress
σ′v0: effective vertical stress
Non-normalized SBT index (pre-1990):
In the 1986 and 1990 charts, Robertson plotted qc vs. Rf (or log-scaled versions) to define empirical zones corresponding to soil types such as:
Sensitive fine-grained soils
Clays
Silty clays to clayey silts
Sandy silts to silty sands
Sand mixtures
Sands to dense sands
Gravelly sands
This approach works well in uniform, normally consolidated soils but can be affected by depth or overburden stress.
Normalized parameters and SBT Index (2010):
To address depth effects and stress dependency, Robertson (2010) introduced normalized CPT parameters, most notably:
Qt = (qc - σv0) / σ′v0 – normalized cone resistance
Rf = (fs / qc) × 100% – friction ratio
Ic: Soil Behavior Type Index
The normalized SBT index (Ic) is calculated as:
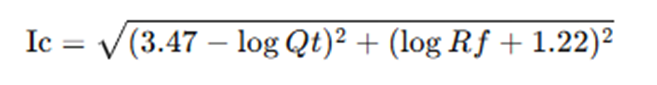
This formula allows continuous soil classification with depth and accommodates varying overburden pressures.
References
Robertson, P.K., & Campanella, R.G. (1986). Interpretation of cone penetration tests — Part I: Sand. Canadian Geotechnical Journal, 23(1), 62–78.
Robertson, P.K. (1990). Soil classification using the cone penetration test. Canadian Geotechnical Journal, 27(1), 151–158.
Robertson, P.K. (2010). Evaluation of cone penetration tests (CPT) for geotechnical design. Canadian Geotechnical Journal, 47(8), 845–875.
Activated ags files
| # | Project | Ags Name | Net area ratio | Correct Core Resistance | Classification Method | Actions |
|---|
Enter Data Using Excel File
Enter Data manually
| SN | Depth | Cone Resistance | Sleeve Friction Resistance | Pore pressure | Corrected Cone Resistance | Friction Ration | Non-Normalized SBT | Gamma soil | Total Overburden Stress | In-situ Pore Pressure | Effective Overburden Stress | Normalized Cone Resistance | Normalized Friction Ratio | Normalized Pore Pressure | Normalized SBT | Classification |
|---|---|---|---|---|---|---|---|---|---|---|---|---|---|---|---|---|
| m | kPa | kPa | kPa | kPa | % | - | kN/m3 | kPa | kPa | kPa | - | % | - | - | - |