Choosing the right Elastic Modulus from N SPT Correlations
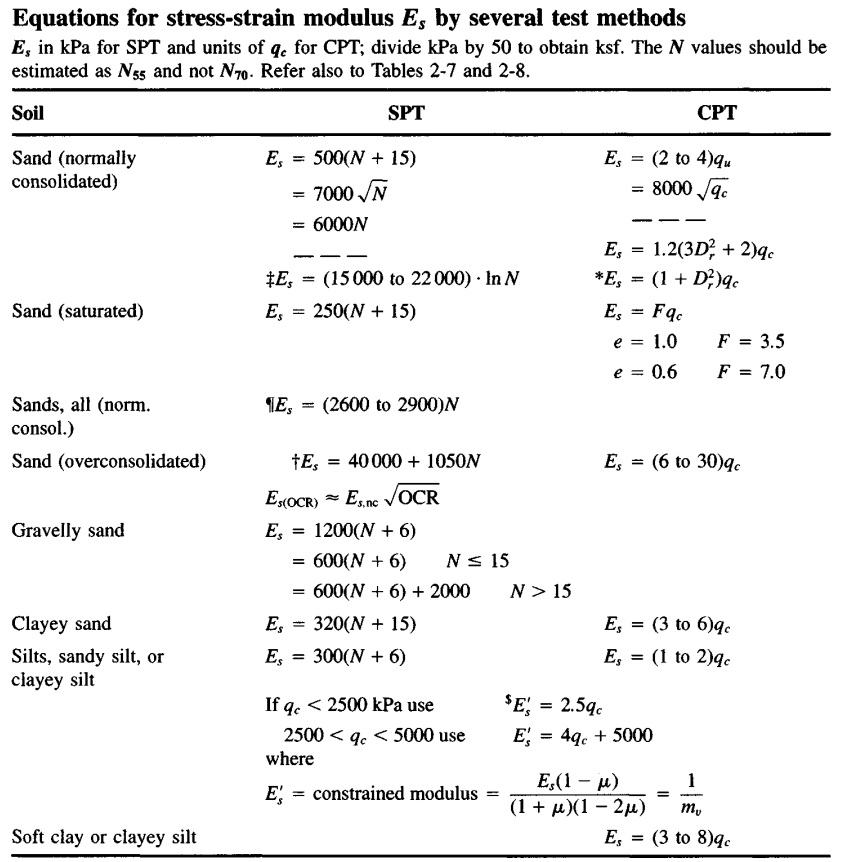
Some of the most commonly used equations for elastic modulus of soil are summarized in Foundation Analysis and Design by Joseph E. Bowles. These correlations connect field measurements, mainly SPT blow counts (N) and CPT cone resistance with the elastic modulus of the soil.
But at first glance, this extensive table of equations can feel intimidating.
Which one should I use for my soil?
Am I being conservative?
Or am I unintentionally under or overestimating stiffness?
Open the relevant table for normally consolidated sand and you immediately see the challenge. The modulus may be expressed as a function of N, √N, (N + 15), or even ln N. Each expression is legitimate. Each is backed by case histories and experimental databases. Yet if you plug in the same N-value into different equations, you may obtain results that differ by a factor of two or more. And that difference is not academic. It often directly affects predicted settlements, raft thickness, pile group behavior, soil–structure interaction stiffness and ultimately foundation cost.
The instinctive response is often to select the “most conservative” stiffness. Yet conservatism in modulus selection is rarely straightforward. Choosing a lower stiffness will indeed increase predicted settlements, potentially steering the design toward a heavier, more costly foundation solution. However, adopting an unrealistically low modulus can also misrepresent soil–structure interaction, artificially redistributing forces and generating behaviors that do not reflect the actual ground response. In that sense, conservatism can become an easy refuge rather than a disciplined engineering decision. True judgment lies not in simply lowering parameters, but in selecting values that are defensible, evidence-based and consistent with the expected governing mechanisms and system response.
The deeper issue is that these correlations are not interchangeable. Each carries embedded assumptions about stress level, gradation and composition and how the original N-values were derived and corrected. Most were calibrated against specific case histories and loading conditions, and their stiffness values reflect those particular circumstances. And this summary tables does not state these limitations explicit. Recognizing the context behind each equation and judging whether it fits the analysis at hand, is where experience and engineering judgement become essential.
Bowles remains an extraordinary source of knowledge, especially when advanced laboratory or in-situ stiffness testing is unavailable. And still, in many real-world projects, we rely on SPT data because that is what we have.
To improve transparency in modulus selection, a simple visualization framework was developed focusing on SPT N-young’s modulus correlations. The objective was to examine how the different Bowles correlations behave across a realistic range of N-values. When plotted side by side, the divergence between relationships becomes evident. Certain correlations increase stiffness rapidly at higher N-values, while others follow more moderate trends. The resulting spread highlights how sensitive settlement predictions can be to the chosen modulus relationship, making the implications of parameter selection explicit rather than abstract.
The goal of the tool is to support engineering judgment. When you can see how your chosen equation compares to alternatives, you are no longer selecting a formula. You are selecting a stiffness strategy. You understand the bandwidth of possible behavior and can justify your assumption within that range.
Bowles gives us the equations. The responsibility to interpret them remains to the engineers.
Check Orycta’s elastic modulus of soil geotool to better understand the implications of selecting among Bolwes young’s modulus equations.